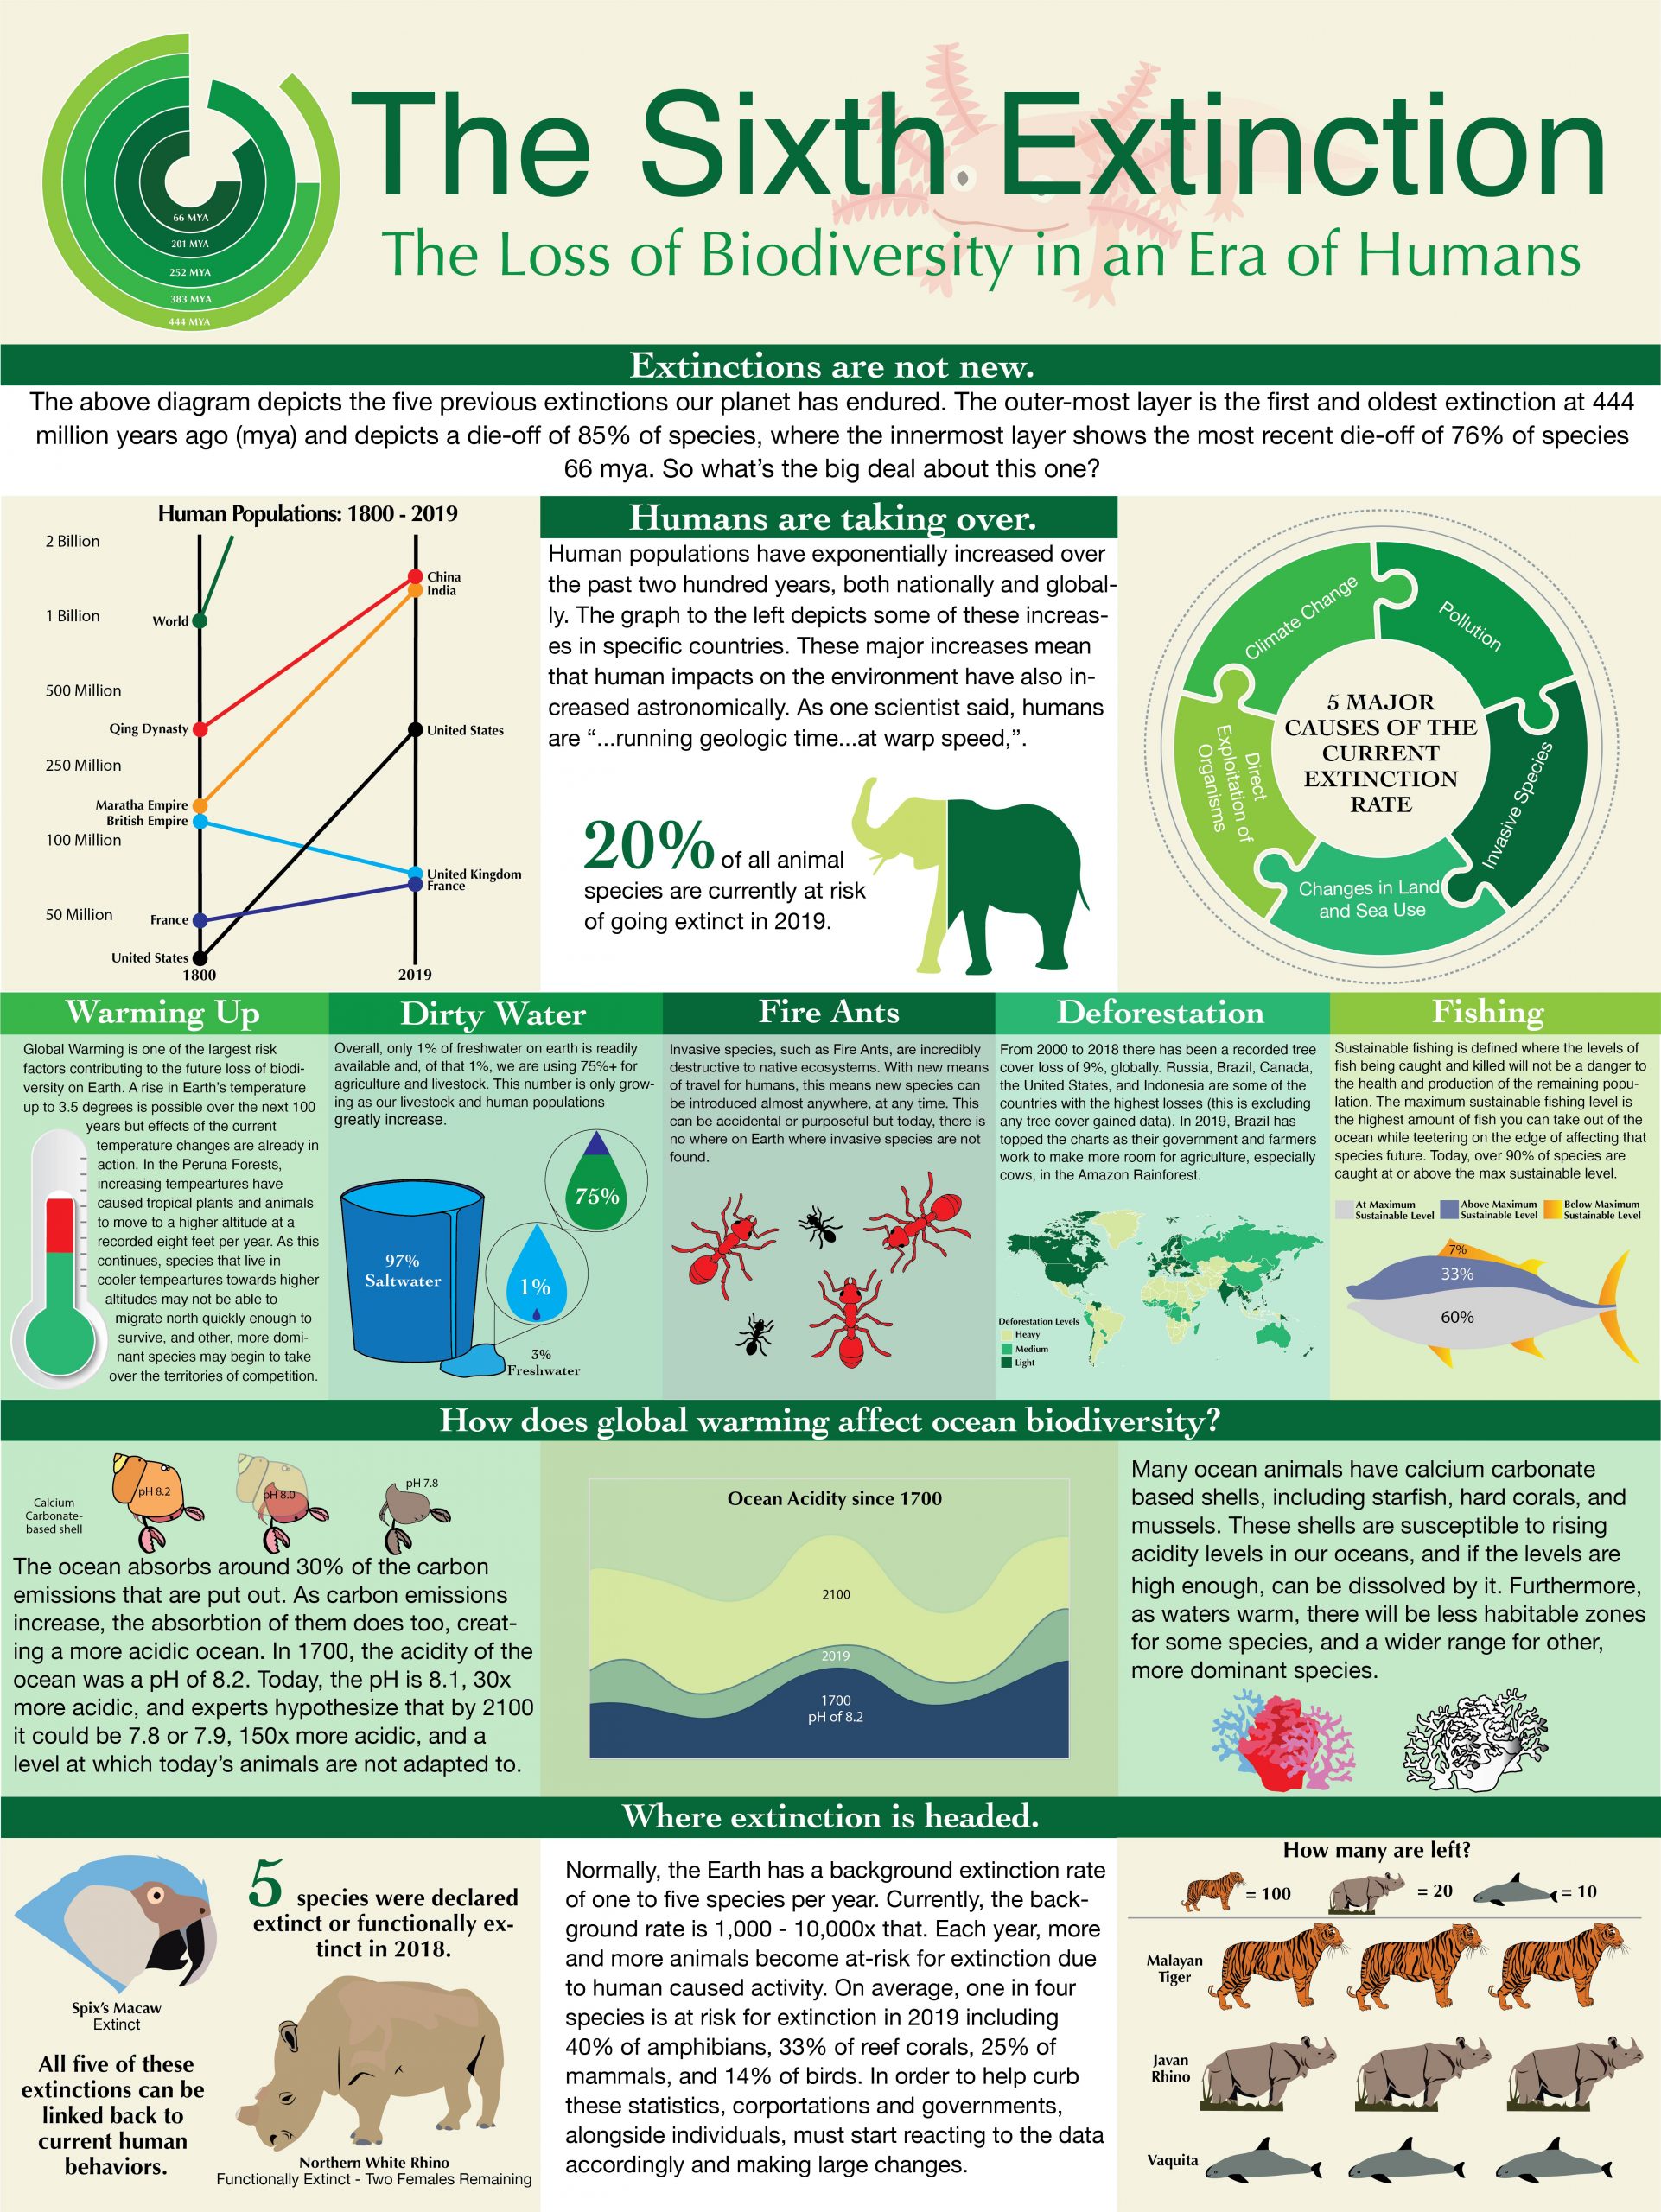
During my M.A. in Interactive Media experience I had the pleasure of taking my first Visual Aesthetics course. One of our projects in that class was to create an information graphic design that fell under the branch of “environment”. Originally, this was a team project, and to give credit where credit is due, my partner, Kwame Amponsah, designed the map graphic in the middle and the Malayan Tiger graphic in the bottom right hand corner. I came up with the idea of doing this graphic on the loss of biodiversity in the world, as I had taken courses on similar topics in undergrad, and had read the book, “The Sixth Extinction” by Elizabeth Kolbert just the year before and felt confident in my knowledge and ability to continue to research.
When it comes to the loss of biodiversity, there is a plethora of information. It was my job, as decided between Kwame and I, to determine what information was needed and could best be broken down and implemented. From there, I did several different sketches of what the layouts could be, as well as different ways to present the information. Kwame and I met multiple times to narrow down the possibilities, but he ultimately agreed with what I thought would be best, including the color scheme.
PROJECT INFO.
CLIENT: iMedia Visual Aesthetics Course Project - Professor Phillip Motley
DATE RELEASED: October 2019
MY ROLE(S): Graphic Design | Information Design TOOLS USED: Adobe Illustrator, Academic Search Complete Research Database
TAGS: Infograph, Graphics, Research
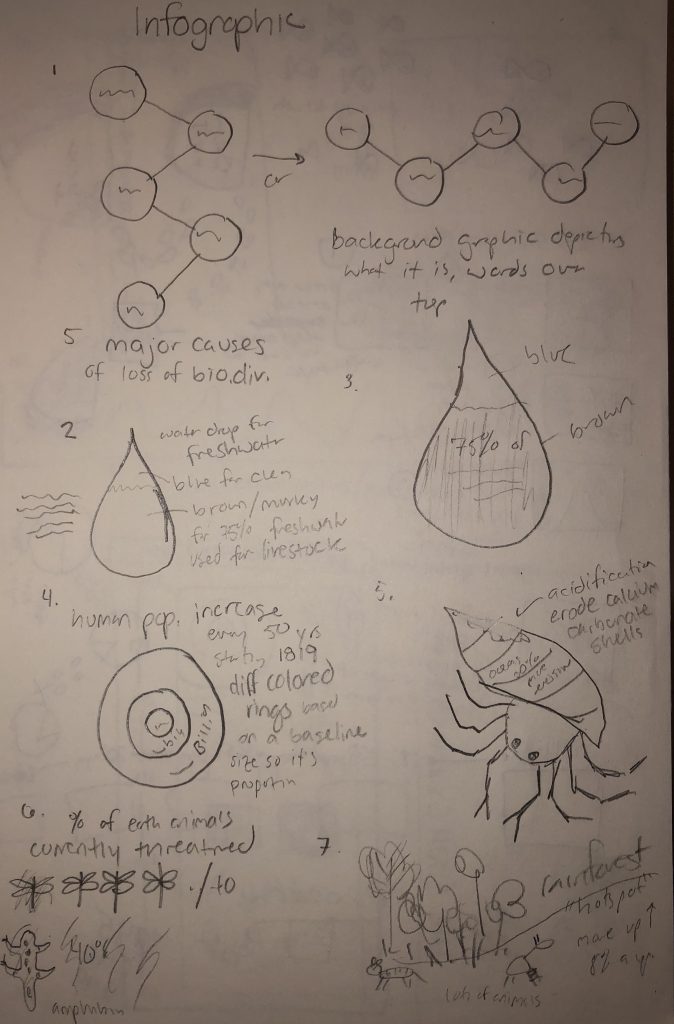
Sketches depicting different possiblities for numeric or verbal data visualization.
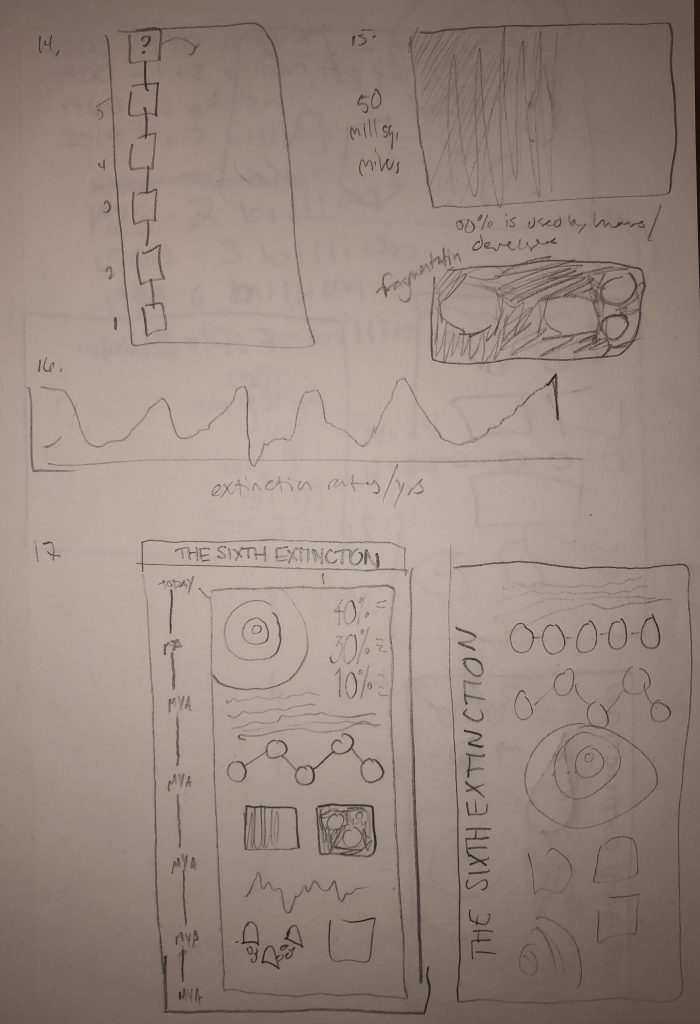
Sketches depicting possible layout ideas for the infographic.
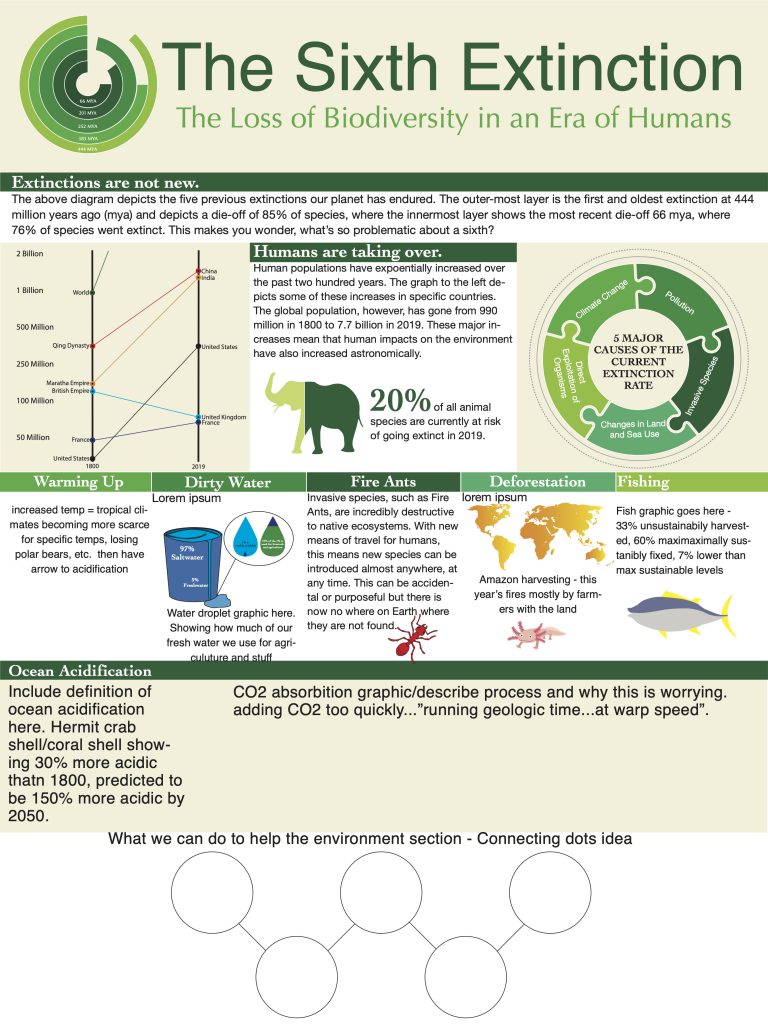
Draft about midway through the project. The main challenge I was having was figuring out how to implement the lower half of information, as well as the five categories in the middle, as they were the most important in closing the grpahic.